
After describing in a recent blog the odds of hiring the top 10% of talents, I would like to delve deeper into our prejudices and biases about how the world works. What’s the real difference between an extraordinary candidate versus someone who seems only slightly less qualified?
Let’s start with a little bit of math (but not too much).
The distribution of a statistical data set (or a population) is a listing or function showing all the possible values (or intervals) of the data and how often they occur1.
The most obvious distribution that comes to mind is normal distribution (or Gaussian distribution). It’s all around us. Let’s take human height2, blood pressure or points on a test, for example. They all follow a symmetric bell-shaped distribution.
Normal distribution influences our world view
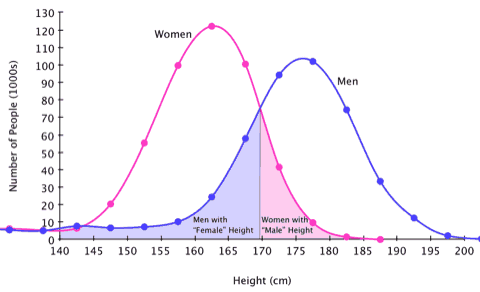
Have a look at the graph below, which shows human height.
 https://sugarandslugs.wordpress.com/2011/02/13/sex-differences
The average height is the most common in a population. Smaller groups of people are considerably shorter or taller than the average height.
When we remind ourselves of our school days, we can notice quite similar patterns in test scores. There were a few extraordinary children, a few who challenged the education system and a whole lot of mediocre ones in the middle.
So when we think about the performance of an employee, we often perceive it in a similar way. The vast majority of people are in the middle, there are a few underperformers and a few exceeding our expectations.
Based on this view, we draw the following conclusions:
- Most people are in the average zone.
- An equal number of people are below and above the average zone.
- The difference between the average and the best is not huge. As seen with height, the average male height is around 175cm while the tallest is around 200 cm, so the difference is only approximately 12.5%.
Let’s see how this model works for outlining employee performance distribution.
Performance distribution for blue-collar workers
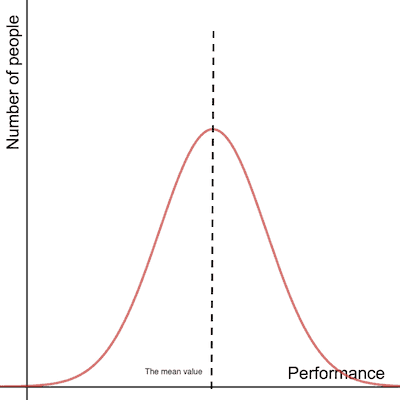
Studies have shown that the performance of blue-collar workers can indeed be described with a bell-curve (e.g. it follows normal distribution). The best performers are about 20% more efficient than the average 3.
Have a look at the graph below. Most people are in the middle (around the mean), and there are equivalent groups of people with lower and higher performance levels: more or less like the distribution of human height.
However, this model was more useful in the Industrial Age, when most people were performing simple jobs, often on an assembly line. In the case of white-collar workers (knowledge workers) this is no longer the case.
Performance distribution for white-collar workers
When analysing the performance of a white-collar worker, a myriad of factors come into play. It’s rarely only a matter of one’s speed or knowledge; rather, it’s very often a mixture of one’s knowledge, experience, motivation, perseverance and probably hundreds of other factors.
The complexity of a job makes differences in people’s performance staggering. One employee can be as productive in terms of delivered business value as a few other employees combined.
Researchers say that a top life insurance sales person can be 240% more productive than the average one. In case of a software developer, the difference might be as high as 1,200%3.
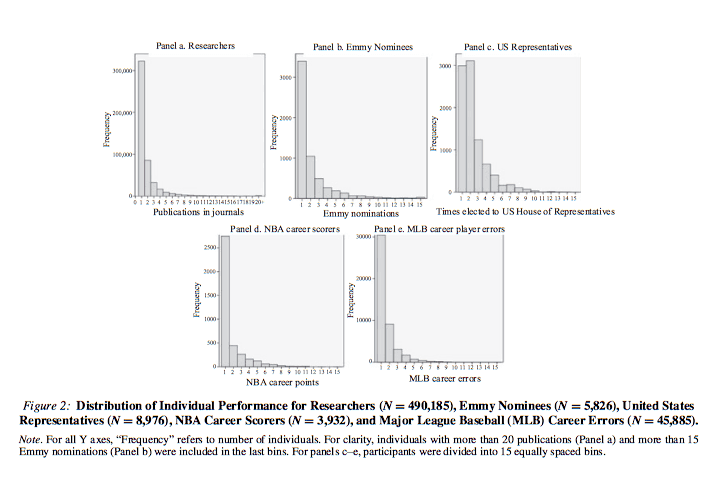
In 2012, a paper titled ‘The best and the rest: Revisiting the norm of normality of individual performance’ was published by Ernest O’Boyle Jr. and Herman Aguinis. They conducted five studies on the subject involving 198 samples including 633,263 researchers, entertainers, politicians and amateur and professional athletes. They made the following observation:
“Results are remarkably consistent across industries, types of jobs, types of performance measures, and time frames and indicate that individual performance is not normally distributed – instead, it follows a Paretian (power law) distribution.”
Have a look at the graphs below showing results of the studies.
Power law distribution
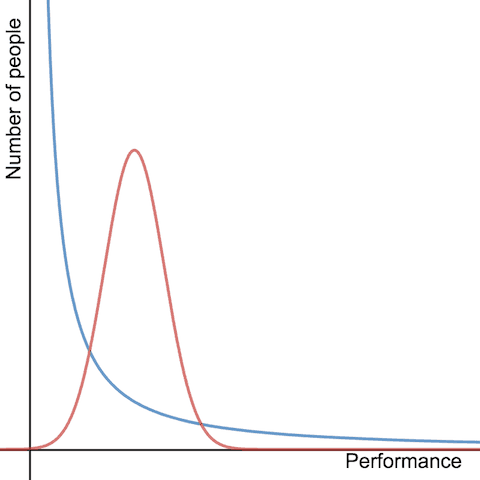
Now look at the graph below, showing performance distribution of knowledge workers.
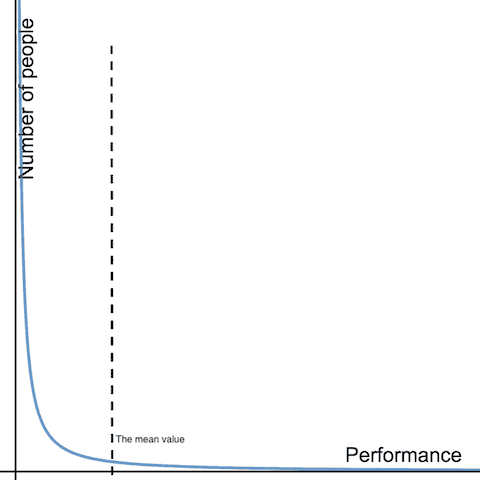
There are two main differences from normal distribution:
- More people are below the mean than in normal distribution
- More people exceed the average performance by a factor of several times (so called ‘long tail’) compared to normal distribution
From this we can draw the following conclusion:
When the complexity of a job increases, performance distribution starts to follow the power law distribution rather than a natural distribution.
How power law distribution affects the recruitment process
Thinking in terms of the normal distribution model and applying it to knowledge worker candidates causes us to dramatically underestimate the differences between an average candidate and an extraordinary one.
Without knowing how the performance is distributed in the candidate pool, we might feel that someone is only slightly worse, when in reality he might be several times worse.
Looking at power law distribution, we quickly notice that a very large number of people are average performers and a much smaller number of people are above the average. More productive people, often several times more productive, are much less frequent in the population.
Clearly, the recruitment process has to be adjusted to account for a greater polarisation in the candidates’ performances than we thought.
Revising our evaluation techniques, however, is not enough to improve our accuracy. Marketing (employer branding) needs to be changed, as well. If you want to hire the people who are X times more efficient, you must target them specifically—and they usually have much different requirements for the job than the average Joe.
Conclusion
When evaluating someone, it’s good to keep in mind that individual performance of knowledge workers varies significantly, to the point where one person can be as efficient as three other people combined. Think about it next time, before deciding to hire someone only slightly less qualified than required.
Let me know what do you think; do you also see massive differences between people when recruiting them? Ping me on Twitter at @wijet.
Notes
-
What the distribution tells you about a statistical data set ↩
-
Although there are some discussion on the internet that human height doesn’t follow a normal distribution. Have a look here ‘Why heights are not normally distributed’ ↩
-
‘Great People Decisions: Why They Matter So Much, Why They are So Hard, and How You Can Master Them’ by Claudio Fernández-Aráoz ↩ ↩2